RABOT app showing the redesigned EV connection flow with Smart Charging activation step

Smart Charging Adoption

Turning an activation gap into a retention lever

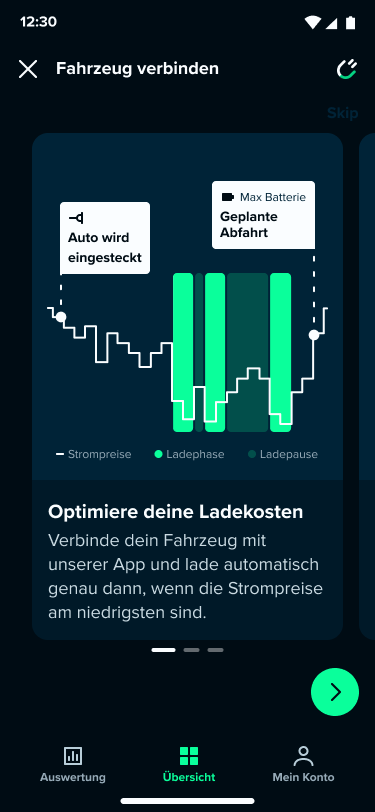
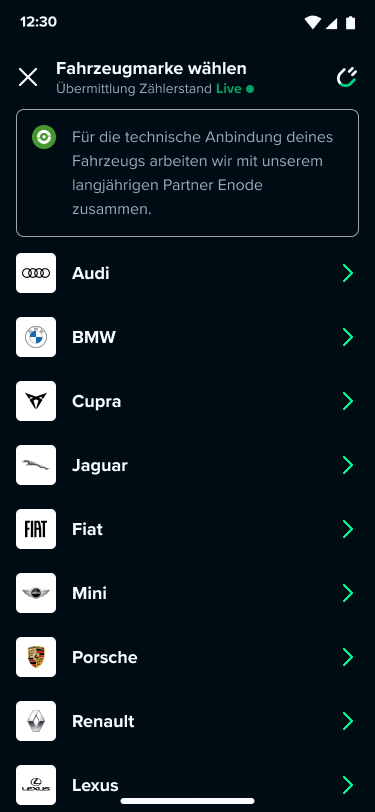
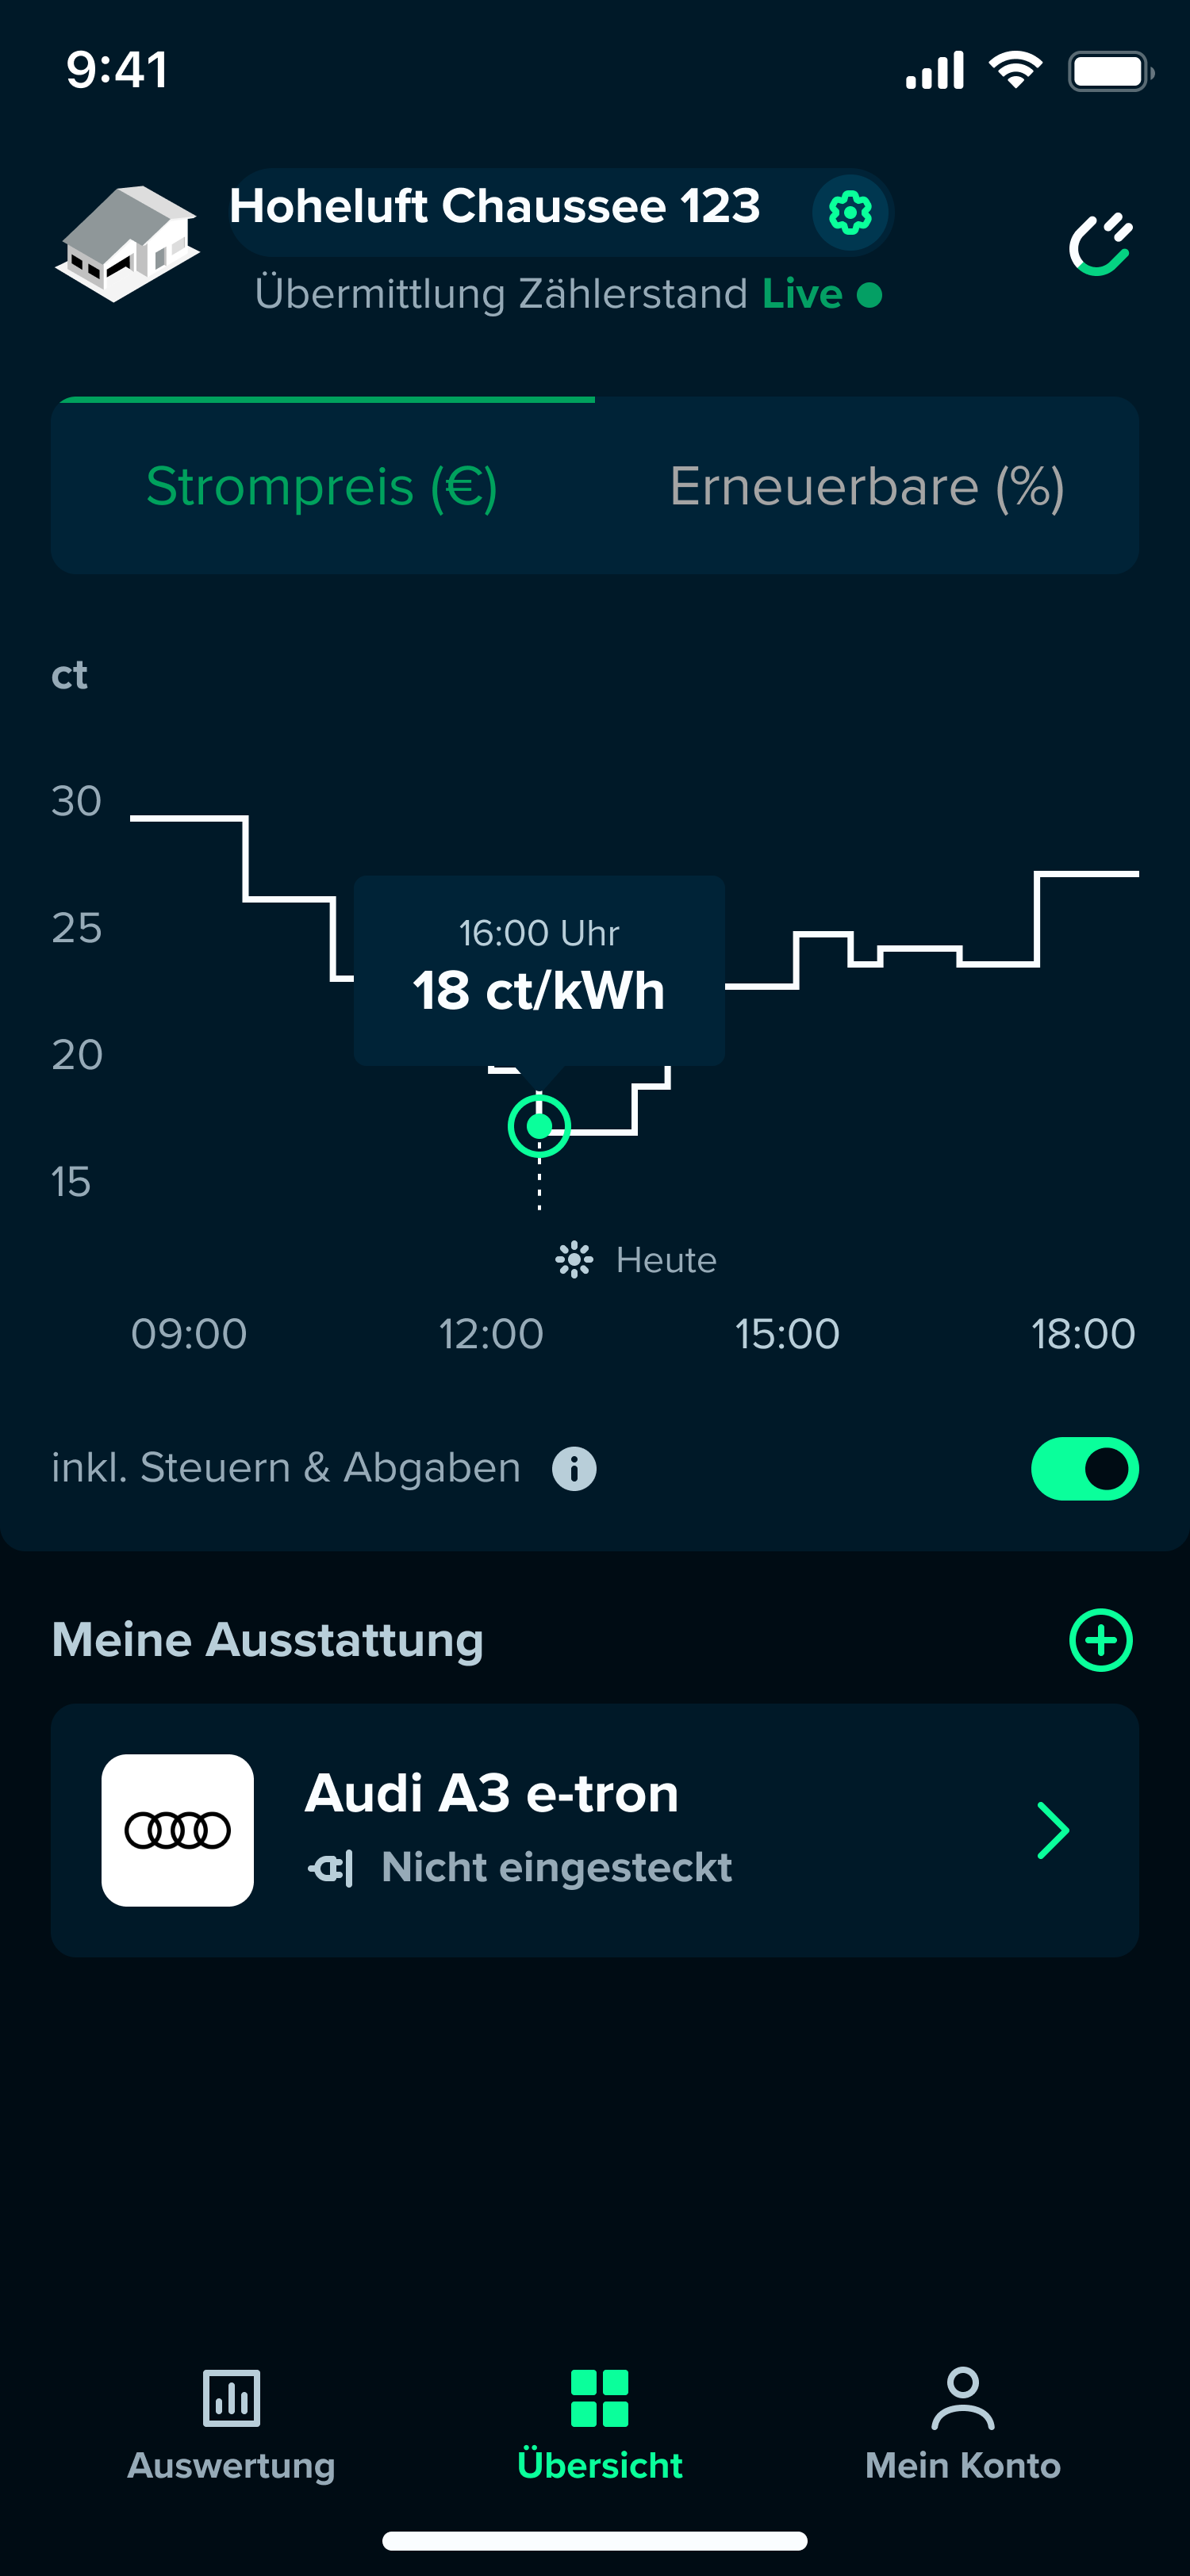
Only 29.8% of RABOT users with a registered EV had Smart Charging active, a feature central to both user savings and RABOT's revenue model. A Q3 2025 OKR tied Smart Charging adoption directly to EV cohort churn. Research revealed the activation wasn't just underused: the flow never asked users to do it.

60.8% 
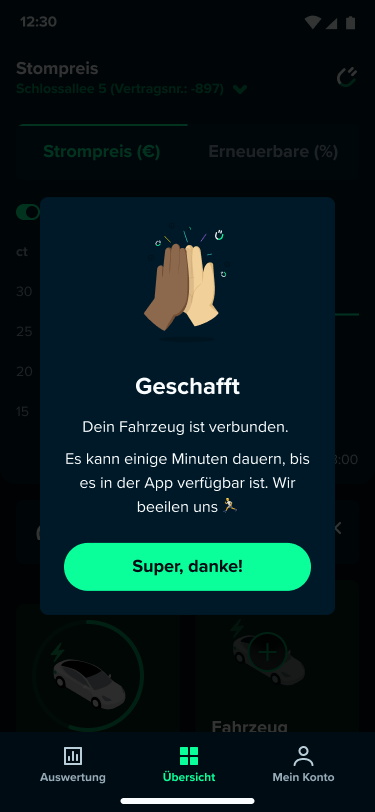
Smart Charging activation on day 1 for new EV users, post-redesign

RABOT Energy · Q3 2025 · Product Design

Product Design Discovery Flutter

Context

RABOT Energy offers dynamic electricity tariffs to German households. Most households default to their regional base provider at a fixed rate with a margin built in. RABOT's alternative passes EEX SPOT prices directly to consumers, with no added margin. Electricity is cheapest at night and during periods of high renewable generation. Users who shift consumption into those windows pay significantly less than they would on any fixed-rate contract, while promoting grid stability and supporting renewable energy. RABOT earns 20% of the savings generated versus the German base provider.

Why Smart Charging is the lever

Smart Charging is the mechanism that makes this work at scale: when a user's EV is plugged in at their contract location, the algorithm automatically times charging to low-price windows. More Smart Charging usage means more savings for users and more revenue for RABOT.

EV plugged in with Smart Charging active
Algorithm charges only during low-price windows
Higher savings vs. fixed-rate base provider
RABOT earns 20% of every euro saved

The Goal

At the start of Q3 2025, the company-wide objective was to keep monthly customer churn at 1.5% or below across all cohorts. For the EV team, the primary key result was to cut monthly EV customer churn by 50% year-over-year. Increasing the share of EV users with Smart Charging active from 29.8% to 40% was the sub-goal the team believed would contribute to reaching that 50%.

Smart Charging activation is what turns a registered EV into an active asset. Growing that cohort was the lever.

29.8% Smart Charging share at Q3 kickoff KR baseline
40% KR target for end of Q3 2025 Actual result: 40.89%

Starting Point

At the KR baseline, 29.8% of EV users had Smart Charging active. The funnel told a more granular story: of users who had connected a vehicle, only 28.4% had ever saved charging preferences, and just 24.8% had Smart Charging running. The biggest drop was before preferences were ever set.

Funnel chart showing conversion from vehicle connected to charging preferences saved to Smart Charging active

Funnel conversion from vehicle connected → charging preferences saved → Smart Charging active. The steepest drop is before users ever reach the preferences step.

2x2 matrix: EV registered vs Smart Charging active. Why not? cohort is the focus.

The "Why not?" cohort: users with an EV registered but Smart Charging not active. This group was the focus of this work.

Discovery

To understand the activation gap, we surveyed all users who had stated owning an EV when signing up for RABOT Energy. Of 584 respondents, the findings pointed to three distinct root causes.

Survey finding: n=584

Savings was the #1 reason users connected their EV

Users connected their car expecting to save money on charging. Smart Charging is the mechanism that delivers those savings. Users without SC active had signed up for a benefit they weren't receiving, making them an expected churn driver in the EV cohort.

Survey finding: awareness gap

13% of EV-connected users didn't know what Smart Charging was

An awareness gap existed even among users who had already connected their vehicle. The inherited onboarding flow introduced Smart Charging at the start of registration, then never mentioned it again.

Problem

The 71.6% drop at "charging preferences saved" was the telling signal. Users weren't abandoning the preferences step: they were never reaching it. The flow was closing before Smart Charging ever entered the picture. (PV system owners, who see narrower SC benefits when solar covers low-price windows, were identified as a distinct cohort and scoped out of this effort.)

The inherited EV registration flow never asked users to activate Smart Charging.

The complete inherited EV connection flow
Click to zoom

EV registration

The flow opened with a Smart Charging introduction before asking users to select their vehicle make and model.

Screens shown are a selection from the registration portion of the flow.

Dashboard default state before EV connected Smart Charging onboarding screen 1 Vehicle make selection

Connection confirmed

A success modal confirmed the car was connected. No mention of Smart Charging activation.

Home screen success modal, EV connected Dashboard with EV connected, Smart Charging inactive

Vehicle settings

The Smart Charging toggle lived here, one tap from the dashboard via the vehicle tile. Nothing in the flow indicated this screen existed.

Vehicle settings, Smart Charging inactive Vehicle settings, Smart Charging active

After users dismiss the success modal, Smart Charging was still off. Activating it required tapping the vehicle tile on the dashboard to reach the toggle. No prompt, no redirect. The flow gave no indication the job wasn't done.

The toggle existed. Users simply had no reason to look for it.

Validating the Current Flow

Users read "Car connected" as "Smart Charging active"

The survey confirmed it: users connected their EV expecting savings to follow automatically. The success modal closed the mental loop. The separate activation step, one tap away in vehicle settings, simply went unnoticed.

Design

The solution was structural: turn Smart Charging activation from a buried post-flow setting into an explicit step in the EV registration funnel. Three rounds of unmoderated usability testing with five participants each refined the approach.

V1: Testing the informed activation hypothesis

The first concept inserted a wizard-style completion flow directly after vehicle authentication: a progress indicator showing three steps (connect, set preferences, activate), an artificial loading moment using the labor illusion principle to orient users before presenting steps, an extracted charging preferences setup pulled out of the vehicle detail screen, and a full Smart Charging benefits explanation with an explicit activate/decline fork at the end.

The hypothesis: users who understood Smart Charging's benefits in detail would activate at a higher rate.

V1 complete flow overview
Click to zoom
V1 step 2: charging preferences with CTA at bottom of screen V1 step 3: Smart Charging activation step V1 step 5: Smart Charging introduction screen with activation CTA

Usability test: 5 participants, unmoderated

5/5 activated. But 4/5 found the explanation condescending.

Task success was complete. Understanding was high. The problem was the last screen: users who already understood SC, or who simply trusted it would work, were annoyed by a step-by-step benefits lecture before the activation fork. A split emerged between curious users who wanted the detail and pragmatic users who didn't. Neither group needed it front-loaded.

3/5 missed the CTA in step 2 (first screen above)

They expected the button inside the corresponding card, not floating at the bottom of the screen.

V2: Progressive disclosure

Two changes. First: the CTA moved into the corresponding card at step 2, matching the mental model users already had. Second: the benefits explanation was removed as a mandatory step: the information remained accessible via an info icon on the activation card, letting curious users pull it when they wanted it rather than having it pushed. The pink rectangle in the flow above marks the step that was cut. The activation fork moved to a contextual bottom sheet to emphasize the decision moment.

V2 complete flow overview
Click to zoom
V2 step 2: CTA moved into card V2 step 4: activation fork in bottom sheet

Usability test: 5 participants, unmoderated

5/5 found the in-card CTA instantly. The bottom sheet broke the flow.

The CTA placement fix worked completely. Removing the explanation caused no drop in understanding or activation: nobody missed it. The bottom sheet, however, created a new problem. The wizard shows three steps that each check off in sequence. Steps 1 and 2 completed visually. Step 3 never did. Users lost confidence that Smart Charging had actually activated.

V3: Shipped

One change: the activation fork moved from the bottom sheet back into the card. The entire flow now lives within the same card-based wizard pattern: connect, set preferences, activate, done. Engineering confirmed that staying within the existing card pattern was also the lower-cost path to implement and better for performance. Easier to build, more consistent to navigate, and the final friction point removed.

V3 complete flow overview
Click to zoom
V3 step 4: activation fork in card

Usability test: 5 participants, unmoderated

All friction resolved. Users cruised through.

No hesitation, no confusion about completion. The in-card activation fork maintained continuity with the wizard pattern, and the vehicle detail screen felt like a natural landing point. V3 shipped.

Results

40.89% Smart Charging share by end of Q3 2025 Target was 40%. Slight overshoot.
60.8% Day-1 Smart Charging activation rate for new EV users post-redesign Measures new-user flow effectiveness directly

The 40.89% overall adoption rate is the OKR result. It includes all historical users, existing and new, and measures the cumulative effect of the redesign on the full base. The 60.8% day-1 activation rate measures the redesigned flow directly: of users who connected an EV after the new flow shipped, 60.8% activated Smart Charging on the same day.

On churn: the team's validated hypothesis was that asset users (those actively using connected devices) churn at a lower rate than other customer segments. This held throughout Q3 2025. Whether Smart Charging users specifically churn less than non-SC users remains under active validation given the lagging nature of churn measurement on monthly and annual contracts.

A parallel engineering effort ran alongside this work to address SC retention: rewriting the charging algorithm and introducing a charging plan that decoupled the day-ahead price curve from intraday trading. That work is out of scope here.

Next Case Study

Target More Use-Cases

↑ 8.4% iOS · ↑ 12.1% Android non-minute rate selection

View case study →
Target More Use-Cases case study thumbnail